covid-19 visualisation
this page is slightly outdated. (apologies.)
please visit covid-19 visualisation to read the updated version.
how should one behave during the pandemic?
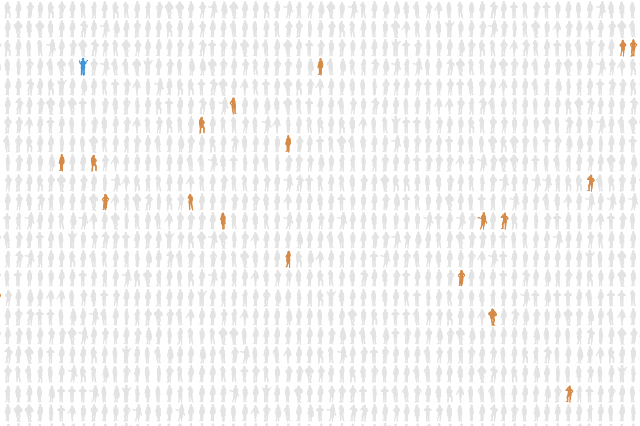
the graphic below shows how widespread covid-19 is in a group of 10,000 people in {note}.
a — is you. (can you find yourself?)
A — is an infected person.
now,
socialising brings you
in contact with a lot of people
: you may choose to
limit your movements
instead.
if you interact with people
while infected,
you risk infecting others : you may
isolate at home till you recover.
if you absolutely must
move-about
for the sake of your livelihood, please act responsibly, and follow covid-19 guidelines.
project collaborator: rohit sharma
data: covid19.who.int, data.worldbank.org
assets: weepeople font
originally drafted over 202004–06, at the start of the covid-19 pandemic. published (two years later) in 202211.
shobhan s
projects
-
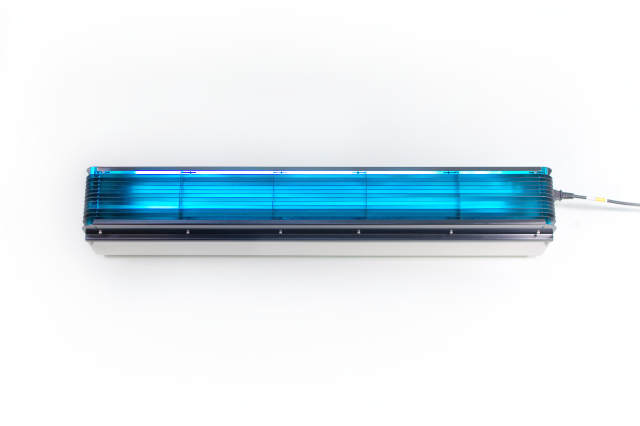
safaire 2022 an affordable air-disinfectant.
-
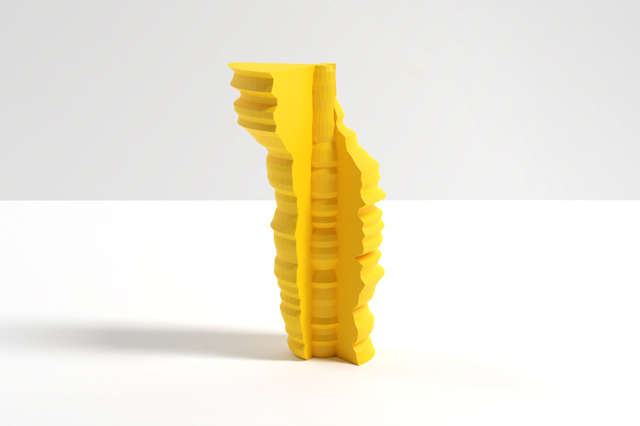
datasculptures 2020–21 turning data into 3d-printed wood.
-

mcd order-taker 2020 multi-modality in voice-led conversational interfaces.
-

the cost of war 2020 visualising an endless stream of violence.
-
covid-19 visualisation 2020
-
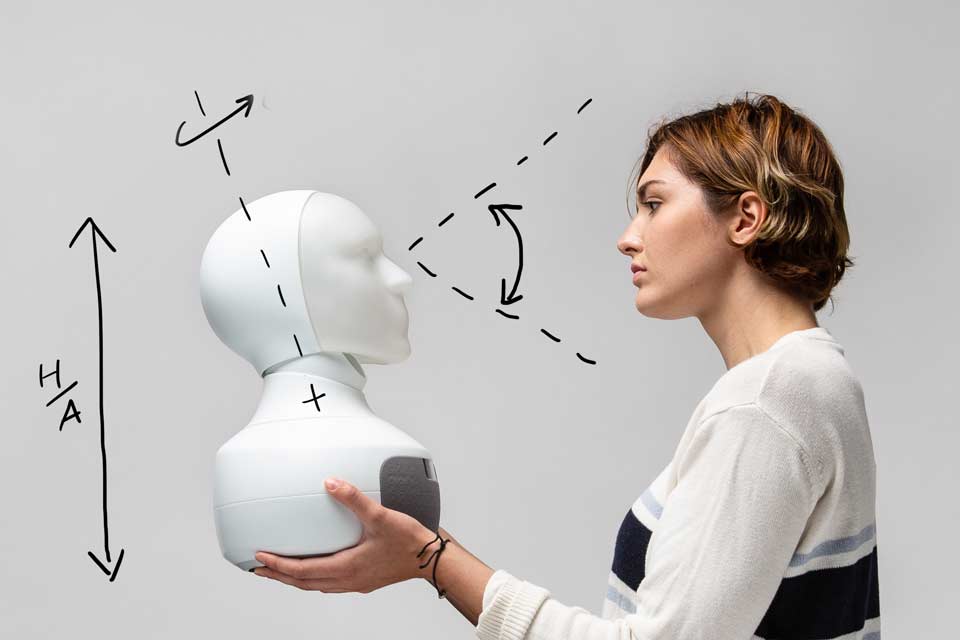
furhat 2019 a multi-modal situated social robot.
-

pragnya identity 2019 identity for a construction company.
-
srishti: expressive objects 2018 artist residency & teaching.
-
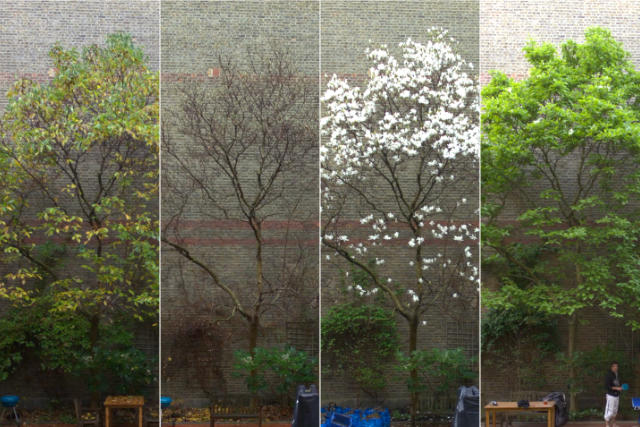
tree 2017–18 watching a tree for one year.
-
swarm xiii 2018 simulating collective behaviour.
-
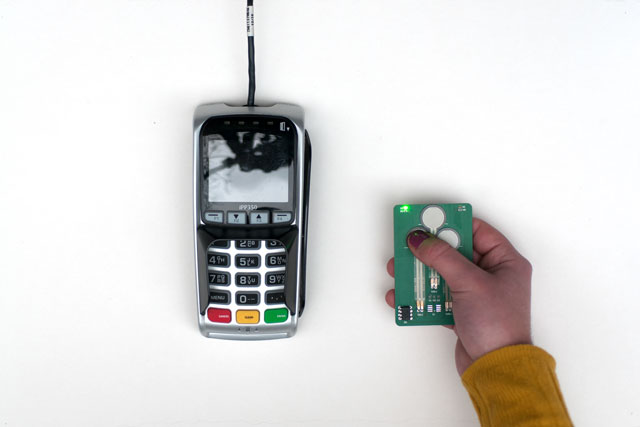
future of the pin 2017 an alternative to smartphones as the de facto means of identity verification.
-
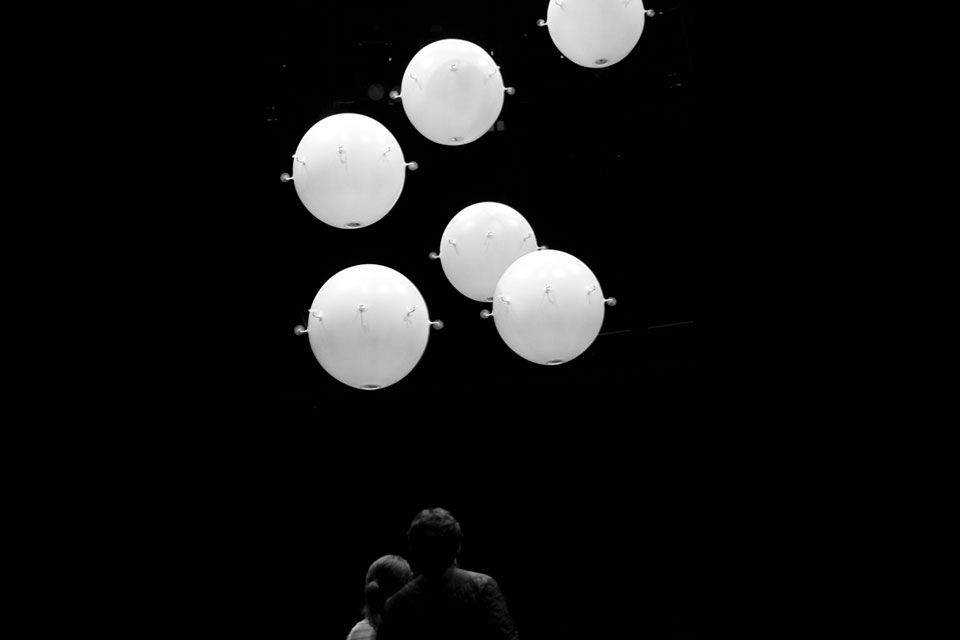
zoological 2017 people and balloon-y bots say ‘hello’.
-
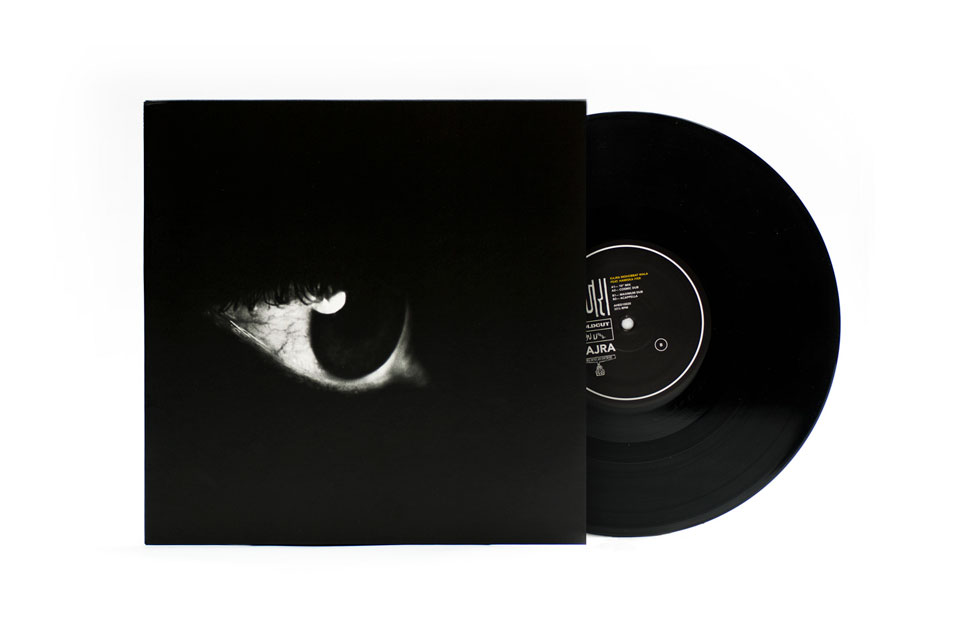
kajra 2017 vinyl cover for coldcut.
-
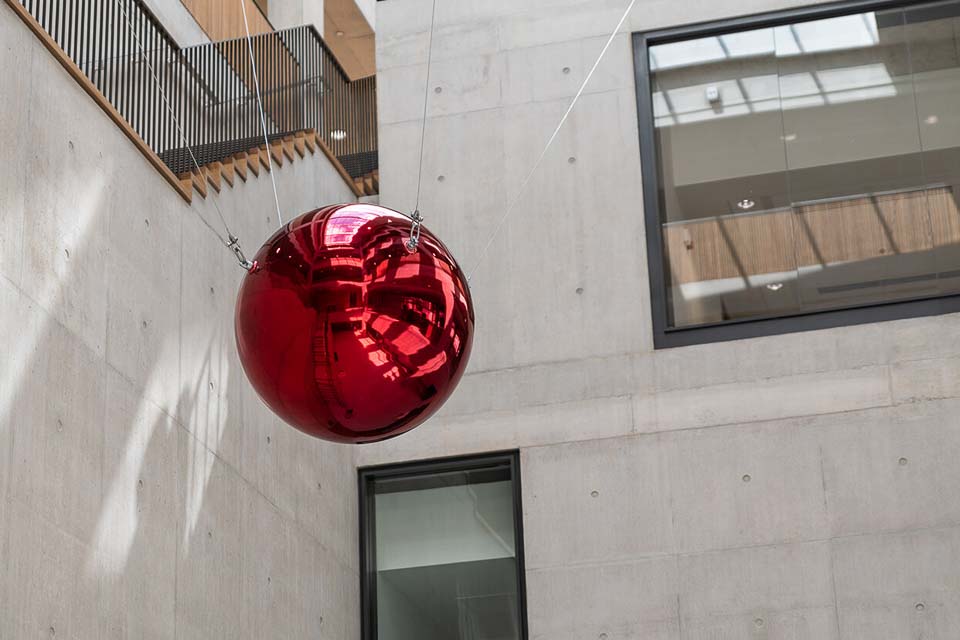
kinds of life 2016 an autonomous balloon at a children's hospital.
-
the cost of war 2016 the true cost of war is paid by civilians with their lives.
-
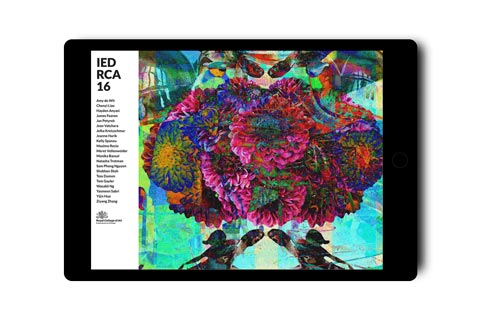
ied-16: identity 2016 advertising hybrid designers-engineers-artists.
-
collaboration for expression 2015 thoughts on collaboration, people & algorithms.
-
inflating curiosity workshop 2015 pneumatics and play.
-
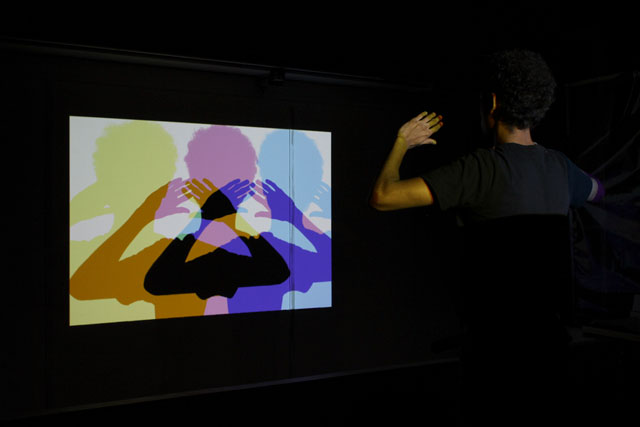
aspect 2015 what if projectors didn't ask people to get out of their way?
-
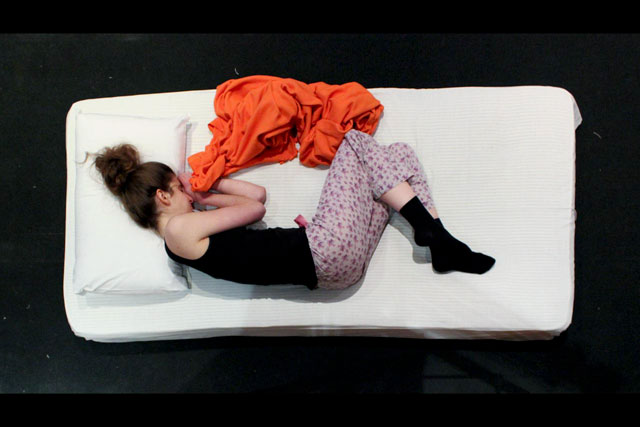
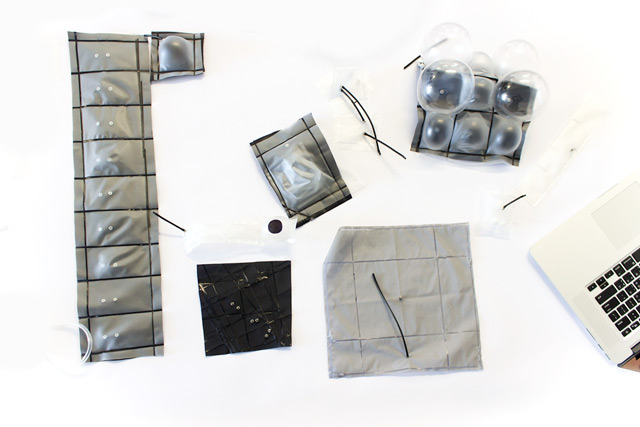
humanoid blanket 2015 humanoid robots do not need to look like people.
-
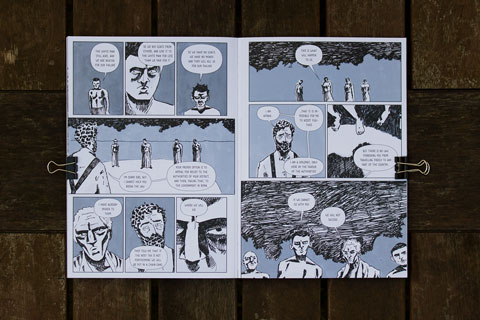
fionnuala font 2015–16 handwritten font for a graphic novel.
-
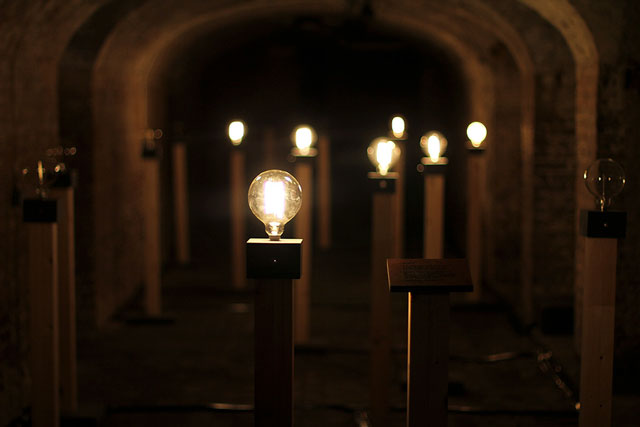
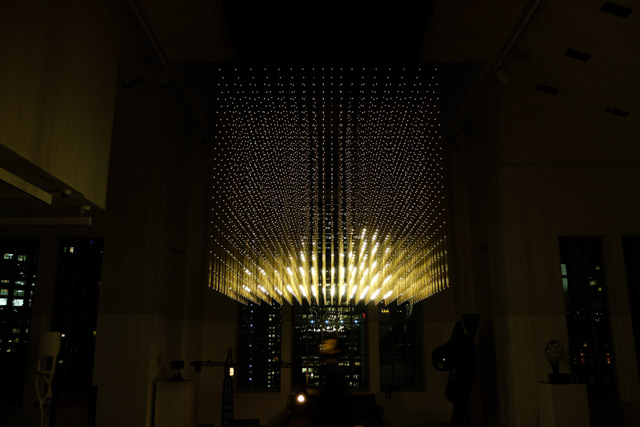
onn/of 2015 explaining quantum physics with bulbs.
-
-640px.jpg)
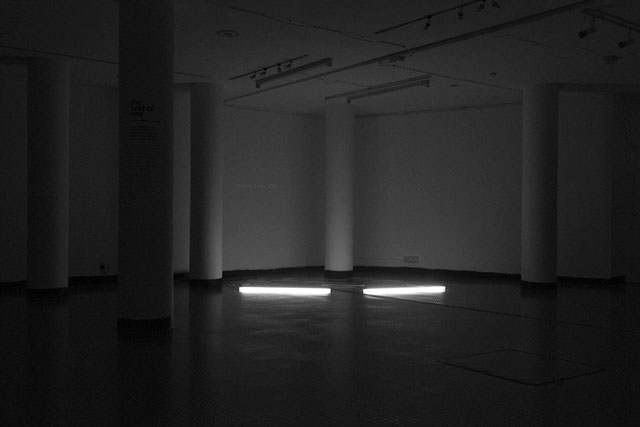
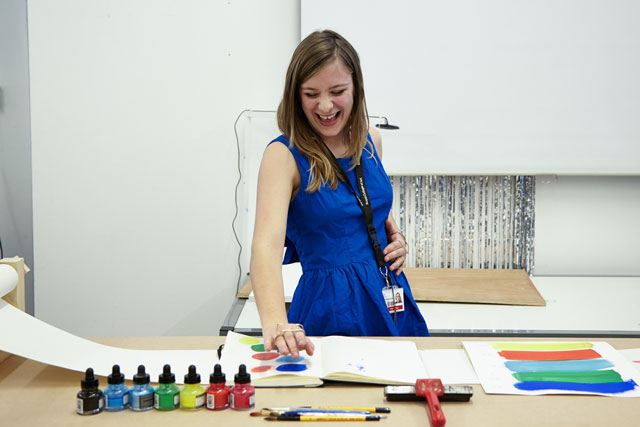
everybody needs somebody 2015 exhibiting a researcher's work on tangible social networks.
-
soundobject 2014 colourful sheet-music.
-

migration tops 2014 spinning-tops to present migration data.
-
bookpad 2014 design lead for a software startup.
-
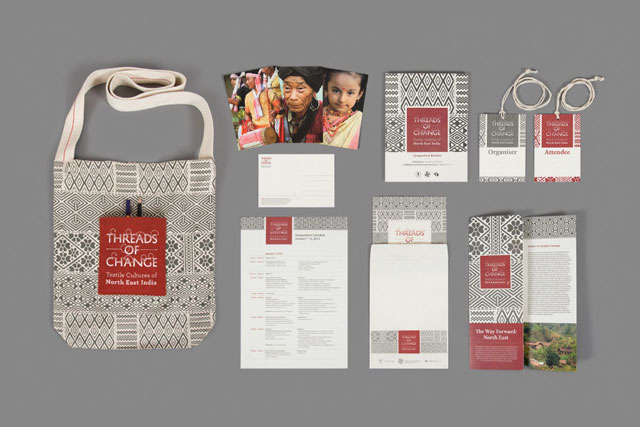
threads of change 2013 presenting textile traditions of north-east india.
-
muvtons catalogue 2012–14 catalogue for industrial wheels.
-
parameterised tree 2012 graphic, code, time.
-
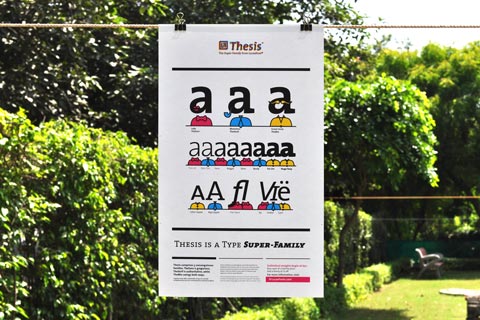
the thesis super-family 2012 (fictional) poster advertising a type family.
-
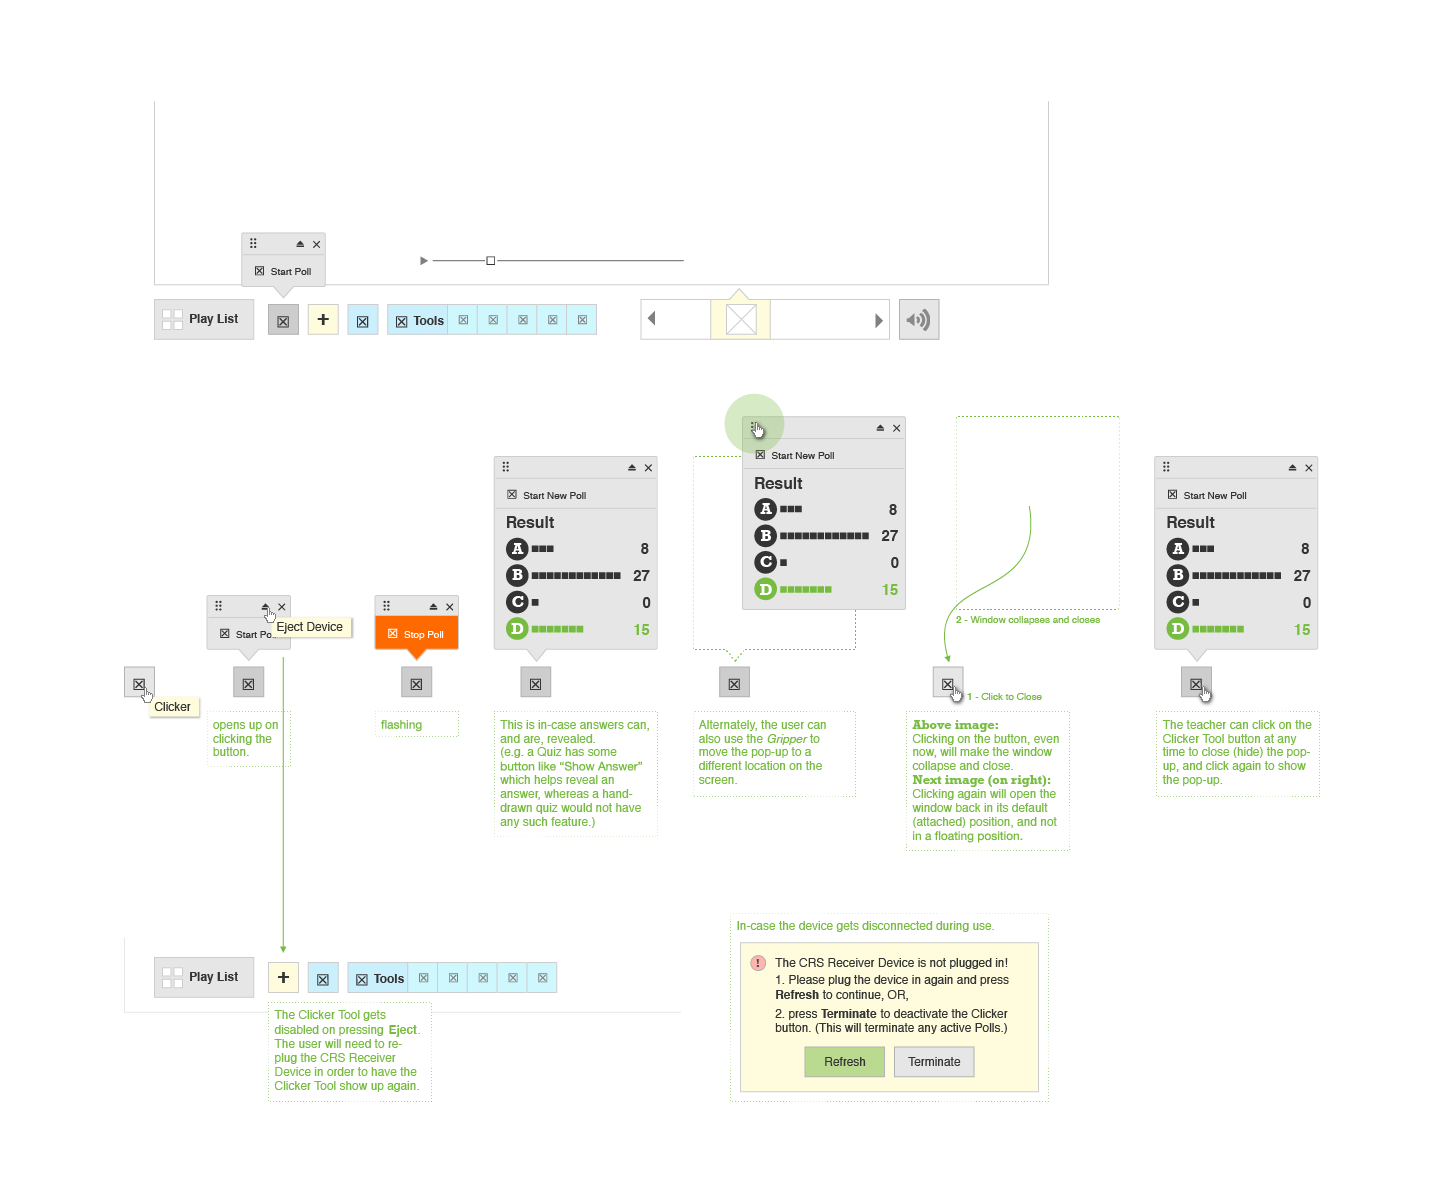
tata classedge 2012 web-portal for educational content.
-

with jwt 2011–13 identity design explorations.
-
bdes work 2007–11 undergraduate study: design methods.